 Question ID = 0064
Question ID = 0064
Question ID = 0064
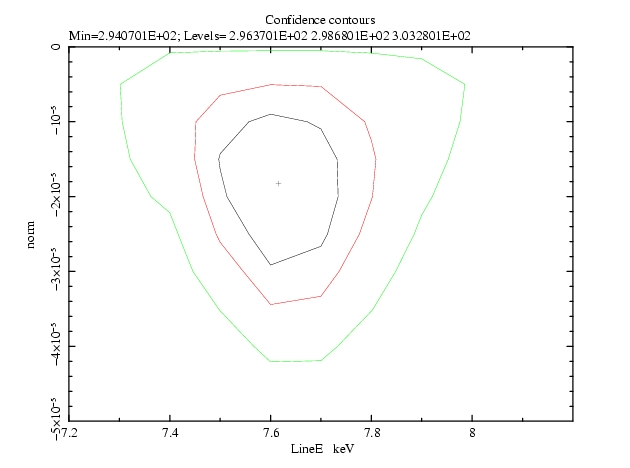
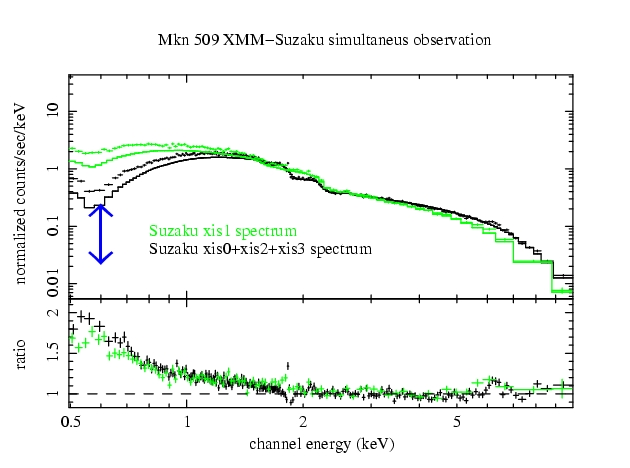
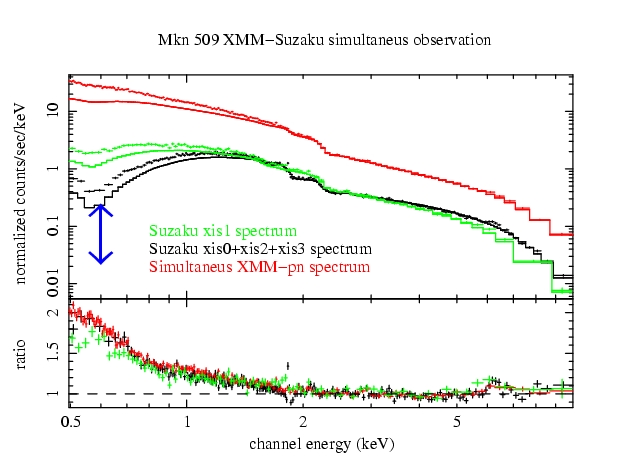
Assigned Member (担当者)2007-09-13 A.BambaName and Institute (質問者/機関)Gabriele PontiQuestion (質問)I am handling the data of a coordinate (simultaneus) Suzaku-XMM observation of the bright Seyfert 1 galaxy Mkn 509. The Suzaku ID of the observation is 701093010 taken on the 25 of April 2006 and lasted 25 ks (exposure time). The XMM one lasted about 70 ks (ID 0306090401) but for the analysis we selected only the 25 ks of time overlapping with Suzaku.Basically we extracted two simultaneus spectra from the xis instruments as well as from the pn camera, and these show different spectral features. These differences suggest that these features may possibly be related with calibration issues. I looked through the web pages of Suzaku in order to understand whether these features are real or related with known calibration problems, but I did not find anything. I would very much appreciate if you may help me in understanding if these features are related to some calibration issue. The main problem occurs when the spectrum from the three xis spectra (xis0, 2 and 3) is compared with the pn spectrum in the 3-10 keV band. Figure 1 shows the spectra of the pn and of the summed xis0, 2 and 3 camera fitted with a power law in the 3-10 keV band. Both spectra have the same shape (within the errors) below 7 keV, but they disagree in the 7-8.5 keV band. In particular the XMM-pn data (in red) have a power law shape, while the Suzaku ones show a drop around 7 and 7.5 keV (observed frame) and then the data rise again with an excess at about 8 keV. The drop in the Suzaku data can be modelled with a gaussian absorption line at 7.6 keV. The closed contours show that the line is statistically significant (see Figure 2, rest frame). On the other hand the line is not detected by the pn and MOS instruments aboard XMM, thus it does not seem to be real. We checked that the line can not be due to background (the feature do not change significantly even if we do not subract the background) and is not due to the summation process (similar contour plot can be obtained fitting the xis spectra simultaneusly but separately). The problem is present even if we introduce in the model a cross calibration uncertainty in the form of a free multiplication constant. Another problem appears at low energy. We fitted the spectra of the xis1 and xis0+2+3 instruments in the 2-10 keV band with a power law absorbed by Galactic material. Then we extrapolated the power law at low energy and a difference in the ratio of the order of 15-20 % appears between 0.5 and 0.7 keV (see Figure 3). Figure 4 shows that the pn data agree better with the summed front illuminated xis data, instead than with the xis1. May this difference be due to the problems of the xis1 instrument at low energy? 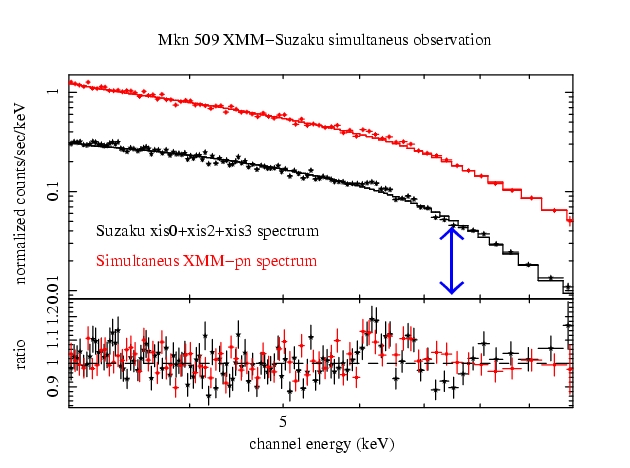
Answer from(回答の文責)XIS teamAnswer (答え)Sorry for our late answers.We have not received any report so far that there exist an artificial structure around 7-8 keV due to the calibration uncertainty. The quantum detection efficiency of a CCD has no sharp structure above ~2 keV and is a smooth function of the X-ray energy. Similarly, the effective area of an X-ray mirror is a smooth function of energy between 3-10 keV. Thus it is difficult to consider that calibration uncertainty produces local structure around 7-8 keV. As described in the technical description, XIS background has Ni lines at 7.5 and 8.3 keV. But the source flux seems to be much higher than the non-X-ray background of XIS. Thus the background subtraction is probably not related to the current issue. As we have no idea what causes the discrepancy between the Suzaku and XMM-Newton spectra around 7 keV, we appreciate if you could perform further analysis on this issue as suggested below. - -. Does the structure significant in each XIS ? We would like to know whether the structure is same for all XIS or prominent in a specific XIS. - -. Could you check the gain with the calibration sources in each XIS ? It is unlikely that a gain error produces a local structure in the energy spectrum. However, line center energies and widths are very useful to check the calibration status. - -. Could you check narrow-band images around 7.6 keV ? It might help us to identify what goes wrong. - -. The gain error can also cause the disagreement in the low-energy band. The gain check should be thus useful to identify the cause of the the low energy problem you mensioned. If your observation used the HXD nominal position, the systematic error of the contamination can be larger than that for the XIS nominal position. This may be related to the low-energy issue. Could you check the absorption column in EACH XIS ? The XIS team appreciates your cooperation very much to improve the XIS calibration. Thank you. XIS team. Status (詳細なステータス)2007-09-12 Accept2007-09-13 Circulate to the XIS team 2007-10-02 Answer from the XIS team 2007-10-03 Done 


|